
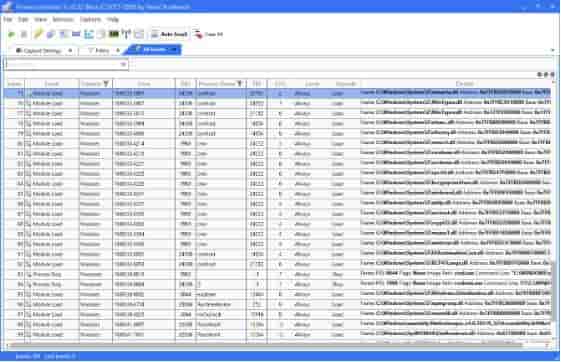
This is an alternative way to get this information without needing a Kernel driver. Keep in mind that the Process monitor also uses this for network events. ProcMonX download is used to provide that same information that is similar in activities to ProcMon, but the best part about it is that it adds in various events such as ALPC, networking, and memory.
On the other side, ProcMonX uses ETW, which is a diagnostic and logging mechanism and has been there since Windows 2000. In this, the providers split out the events that are consumed by their consumers. All such events can be logged into a file that is.ETL extension and can then be analyzed or logged in real-time listening to consumers alternatively.
This is used to create in a real-time session that involves no automatic login to file and register for all the events that are requested by the user (the current list is quite small and more events shall follow in subsequent versions). The data related to the particular activity is displayed as it comes in. All this means that is sacrifices some of the accuracies and is come case pieces of information to get significant events that may not be possible with ProcMon.
SEE ALSO: Top 8 CPU Temperature Monitor Tools for Windows 10 (Download).
Contents
How to Use ProcMonX in Windows Event Viewer
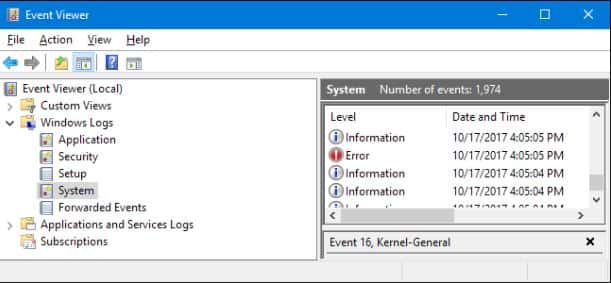
This is used to show in the log of apps as well as system messages that include information messages, errors, and warnings. This is quite a useful tool that is used to troubleshoot different problems related to windows.
Keep in mind that errors and warnings are shown even by the systems that function correctly, and all these can be sorted out by using this. Now, if we talk about scammers, also they use it on occasion to deceive people towards believing that there lies a problem in their system that only they can fix.
SEE ALSO: Download Cyphon – Open Source Incident Alert Management Tool.
In one infamous scam, a person who claims to be part of Microsoft can call anyone and ask them to open up their event viewer. He shall see some error messages here; the scammer is then going to ask for the person’s credit card number to fix it.
Now, as a rule of thumb, if you assume that your system is all fine, then you just can ignore the errors and warnings that appear in this. It is good that you, as a user, have some basic understanding of this tool and know where you can likely use it for some benefit.
How to launch Event Viewer in Windows 10/Server 2012/2016/2019
For this, you need to follow the steps below:
- In the first step, you need to click on the start.
- Then in the search box, type in event manager hit on the result.
The events are placed into various categories; each is related to a log that is kept by the windows on activities related to that specific category. As there are many different categories, the vast amount of troubleshooting that you may want to do pertain to the following three:
- Application logs
This is used to record events that are related to the components of windows like drivers and the built-in interface elements.
- System logs
This one is related to programs that are installed on the system.
- Security logs
As security logging gets enabled (as it is turned off in windows by default), then it is used to record all the events that are related to security like resource access and login attempts.
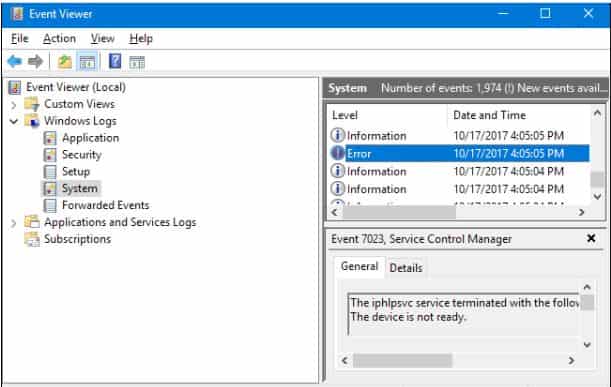
You don’t need to panic!
If your system is working fine, then you are going to see some warnings as well as errors there in the event viewer.
This is designed in a way to helps the system administrators to tabs on their systems and troubleshoot problems. If there are no errors in your order, then the error is not significant. Like you shall see error quite often, that indicates that a program has been crashed at a particular time that may have been weeks before or that a window failed to start with windows, but got started on a subsequent attempt.
SEE ALSO: The Best Terminal Tools for Checking CPU Usage in Linux.
In the image below you, all can see that an error got generated when the steam client service failed to start promptly. We did not have any problems with the client there on the test computer system, so this is a one-time error that corrected itself on a subsequent launch.
Now, in theory, other apps are also supposed to log events to these logs. However, many of the apps do not offer useful information related to the event.
Why Event Viewer is your best friend
- Helps the user if he is troubleshooting a specific problem.
- Users can look upon specific event IDs online that can help to locate information particular to the error that he is encountering.
- You can use this to find your system’s exact boot time.
Processes you need to look out for:
- WMI Provider Host – WmiPrvSE.exe fix and removal.
- Adobe GC Invoker Utility and how to disable it?
- How to Fix Sedlauncher Process High CPU Usage Issues?
Download ProcMonX – Open-Source Windows Event Tracing Tool
If you are a system administrator or just a geek who is looking after a Windows Server environment, ProcMonX download will save you a lot of time. It helps in looking at processes or when you are tracing events.
")
")
")
")

 – Free Documents Tool")