
CPU performance is seemed to be one of the core aspects if you want to measure the performance of your Linux server. Monitoring CPU performance usage is significant to debug the processes within any system, manage system resources, make decisions for the system as well as evaluate and examine the orders in real-time.
Today we will share 7 best Command Line Tools for checking CPU usage in Linux with which you can also monitor and display the performance of CPU plus keep in mind that such kinds of tools depend upon the system calls that are built into the OS with the purpose to extract the readings of the various processes and programs that may be running in the background including Apache, MySQL, and any other services.
Follow through the guide to know about the best CPU usage monitoring tools and their uses in any Linux-based distros.
Contents
Top 7 Best Command Line Tools To Check CPU Usage in Linux
iostat – Make this tool your friend
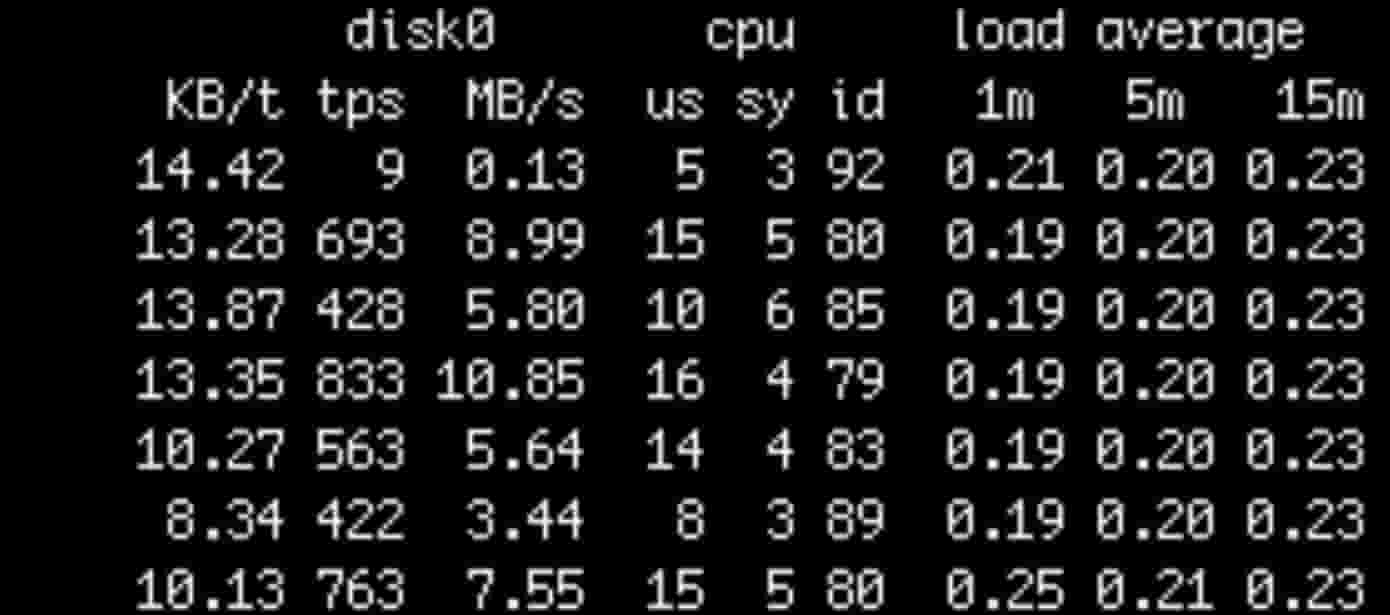
The device utilization, network file utilization, and the iostat command list CPU utilization. The utility is used to display the system’s average usage made by the CPU since its last reboot. If you run the following command, then it shows all the three reports without any options
$ iostat
If you want to list the individual report then you need to use -c, -d and -h switch for the CPU utilization, device utilizations as well as network file system utilization. Use the following command as it is used to break the CPU utilization into system processes, user processes, I/O wait as well as idle time.
$ iostat -c
The following command is used to display the extended statistics (-x option) with the number of time (-t option) each report must be presented for the CPU utilization (-c option)
$ IOSTAT -XTC 5 2
SEE ALSO: 7 Best Linux Courses for Administration, Security, and Training.
Top – The Default Linux Task Manager
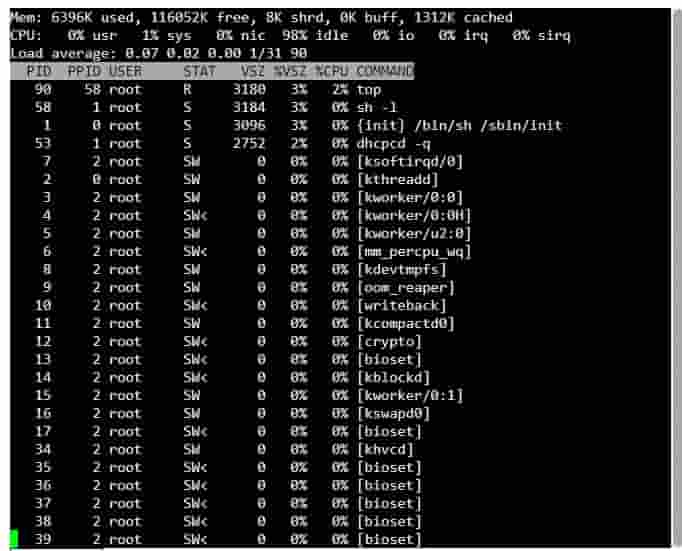
The top commands are used to display the real-time view of performance that is related data of the entire running processes within the system. Now the top command by default is used to update data every 5 seconds. You need to type “top” from the terminal to view the statistical data that is related to the system’s performance.
$ top
Some useful tips for using the top command:
- If you need to modify the output of the top command, you need to type “i” as it is used to remove the idle processes from the display. To go back, you can type “i” again.
- Type “M” if you want to sort data by memory usage.
- Type “S” to sort by how long the processes have been running.
- Type “P” to sort by the CPU usage again.
- Type “U” if you want to view processes that are owned by a specific user.
- Type “K” to kill the processes.
- Type “r” to renice them.
SEE ALSO: How to Delete a Line in VIM Editor – Vim Line Delete Command.
Mpstat
This command can write to standard output regarding all the activities for every available processor, processor 0 being the first one. All the global average activities among the processors are reported as well. This command can be used both on the UP as well as SMP machines, but in UP, only the global average activities shall be printed. If none of the activities have been selected, then the CPU utilization report shall be the default report.
$ mpstat
The mpstat with the option –p and “ALL” shall list all the statistics regarding the CPUs one by one beginning from 0.
$ mpstat -P ALL
The following command is used to list the average CPU usage for four times each after every 2 seconds
$ mpstat -P ALL 2 4
SEE ALSO: How to Ping an IPv6 Address from Linux Terminal.
Vmstat – Find Processes, memory and I/O
This command is used to display the statistics regarding the systems processes, memory, I/O, swap as well as the performance of the CPU. All the statistics are generated by using the data from the previous time the command was run to the present. In case the command has never been run, then the data shall be lost from the last reboot towards the current time.
On various CPU systems, the vmstat averages the number of CPUs into the output. This command can update all its outputs just like the top command and can be executed as shown below. The following command is used to update its report after every 5 seconds unless and until there is an interrupt.
$ vmstat 5
The following command is used to display the data that shall refresh after every 5 seconds, and the values shall be re-measured and reported after every 1 second.
$ vmstat 1 5
Now the first line report is going to have the average costs since the last time the computer got rebooted. The other lines shall display their respective current values. Keep in mind that the Vmstat command can run as a regular user.
SEE ALSO: Top 10 Best Raspberry Pi 4.0 Projects to Try Yourself in 2022.
CoreFreq
This is computer performance monitoring software that was designed especially for the 64-bits processors w/ architecture Intel Atom, Core2, Nehalem, SandyBridge, and superior, AMD Family. This is used to provide a framework to retrieve CPU data with a high degree of precision. Now CoreFreq is made up of 3 parts:
- Kernel module; this shall have full access to the host. It has the responsibility to collect low-level data.
- A daemon
- Userland command-line interface (CLI)
Kernel module, shall have full access to the host. It has the responsibility to collect low-level data. The data is then received by the Userland daemon. This needs to run as root. And then finally, CoreFreq carries a terminal interface to report the data in a format that can be read by humans. The CLI tools are just like any ordinary processor and might be used by the end-user.
SEE ALSO: How to Secure and Harden your Linux Server Security.
Sar
Sar is seemed to be a performance monitoring tool that is used to collect, review as well as record the performance data and can also list what the system is doing at the entire time.
This command is also used to generate the report and then email it to the admin of the system. The statistics that are reported by the Sar usually include I/O transfer rates, process-related activities, paging activity, interrupts, network activity, memory and swap space utilization, kernel activities, CPU utilization, and TTY statistics among others. You can run the Sat command without any option and then check the output yourself.
$ sar
Display CPU statistics three times with 2-second intervals (this can be changed as per your custom):
$ sar 2 3
The following command is used to display cumulative real-time usage of the CPU for every 2 seconds for a total of 3 times.
$ sar -u 2 3
The -P option is used to display the stats for ALL the individual cores. If your system carries four cores, then the CPU column shall bear the numbers 0, 1, 2, 3 indicating the core numbers of the corresponding CPU. The 2 and 3 options are used to display statistics for every 3 seconds 3 times
$ sar -P 2 3
The -P 2 option is used to display the stats for the third core after every 2 seconds three times
$ sar -P 2 2 3
SEE ALSO: How to Install Arch Linux in (Tutorial).
Htop – The best top alternative
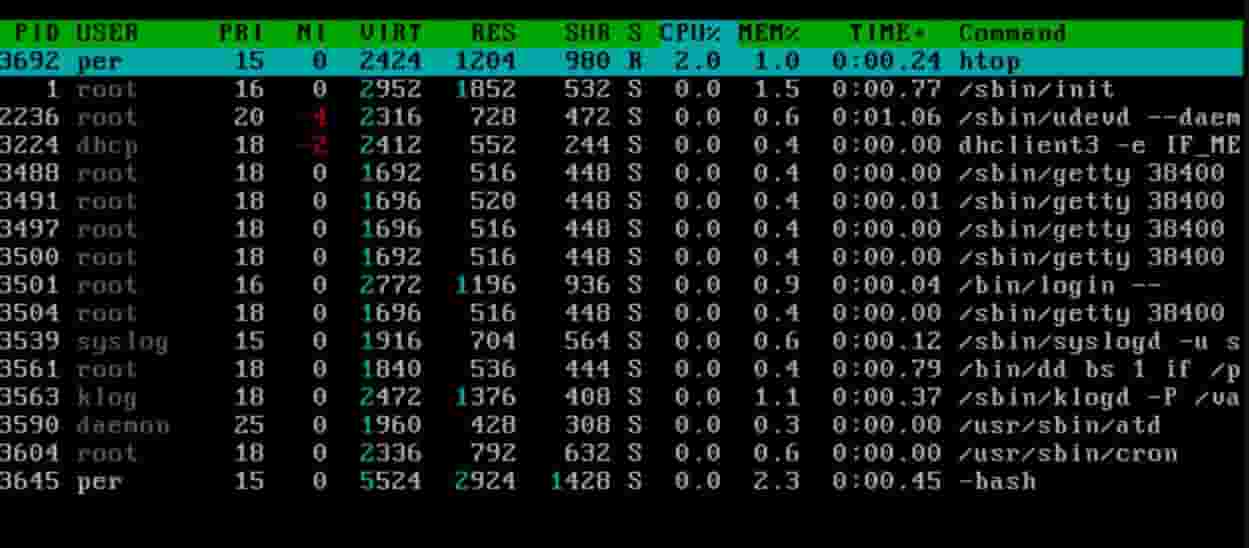
This is a processor viewer as well as a text-mode app for system monitoring in real-time, just like the top command. Now, this can display the complete list of the processes that run and are secure in use.
This is based on courses to view the methods in a GUI-like environment running within the terminal. Moreover, it is also used to display the usage per CPU along with the memory and swap usage with a vital text graph that is printed at the top. It is convenient to use and easy to understand. Once you begin using this, you may never return to the TOP command.
$ htop
The output comes in three different parts:
- The upper part is used to display the system information in the form of three bars that can be changed by using the HTOP setup menu. This part shows CPU Usage, Memory Usage as well as Swap Usage.
- The Middle part is used to list all the processes that are arranged concerning their CPU usage.
- The bottom part is used to show HTOP menu commands.
SEE ALSO: How to Install Software and Packages in Kali Linux.
More Linux articles you will enjoy reading:
- 6 Best GNOME Desktop Environments For Linux (2022 Latest).
- Top 6 lightweight Linux Distros for Slow and Old Computers.
- How to Install Python 3.7 In Ubuntu 18.04/19.04/19.10.
How are you checking CPU Utilization In Linux?
So here, we have now discussed and talked about the 7 best CPU performance monitoring tools for finding the CPU usage. These tools come with a variety of handy options, which you will find in their man pages. A small note for you is that these tools do utilize CPUs when you are running them. A good thing to keep in mind while you wonder what is using your CPU in your Linux server?
Do let us know in the comments below if you have any alternative methods of checking CPU utilization in Linux.


")


